Plans and status reports (Coming Soon)
Give a hierarchy a target date to make it a plan. Everyone who can open the hierarchy then sees how its work is going and when it could be done, the Plans page lists every plan they can open, and the people who look after a plan write status reports about it.
On this page
Every figure on these pages is worked out for the person looking, from the work items they can see in Jira. Two people may see different figures for the same plan. See Where the figures come from.
Making a hierarchy a plan
Open the hierarchy, then choose Plan in the Panels menu on the title line. On a hierarchy that isn't a plan yet, people who can edit it see Make it a plan; everyone else sees who can make it one. Fill in the settings, then select Make it a plan.
| Setting | What it does |
|---|---|
| Target date | The day the work should be done by. |
| Count progress in | Work items (the default), Story points, Hours (original estimate), which uses the remaining estimate when a work item has no original estimate, or Hours (time spent and remaining), the time spent plus what remains. |
| Compare with baseline | One of the hierarchy's baselines, or No baseline. |
| Owner | The person who looks after the plan. It is you unless you pick someone else. |
| Status | Work it out from the forecast (the default), or On track, At risk or Off track as the owner sets it, with a note under Why (shown with the status) of up to 500 characters. |
| Weeks of past work the forecast uses | From 2 to 26 weeks, 8 by default. |
Date boxes take a date typed in figures, in the order your Jira language uses, and say how to type it, for example "Type it as DD/MM/YYYY (30/11/2026), or pick it from the calendar." A target date that has passed is said under the field: "This date has passed. Set a new target." An owner typed but not picked from the list is said too ("Pick a person from the list. What you typed was not kept.").
Once the hierarchy is a plan, its target date shows on the title line, as in Plan: Nov 30, 2026. Select it to open the plan. Plan settings in the plan changes the settings, and Stop being a plan removes them and leaves the hierarchy as it is. Changing a plan needs Edit on the hierarchy, like any other change to it.
A backup keeps a hierarchy's plan. A restore keeps it without its baseline, because baselines get new ids. A copy of a hierarchy is not a plan.
The plan view
On a wide screen, the plan opens beside the grid, from the toolbar down, so the rows stay in view. On a narrow screen it covers the grid and the timeline. Close brings them back. It opens again next time if you leave it open. It has five tabs: Summary, Progress, Forecast, Changes and Snapshots.
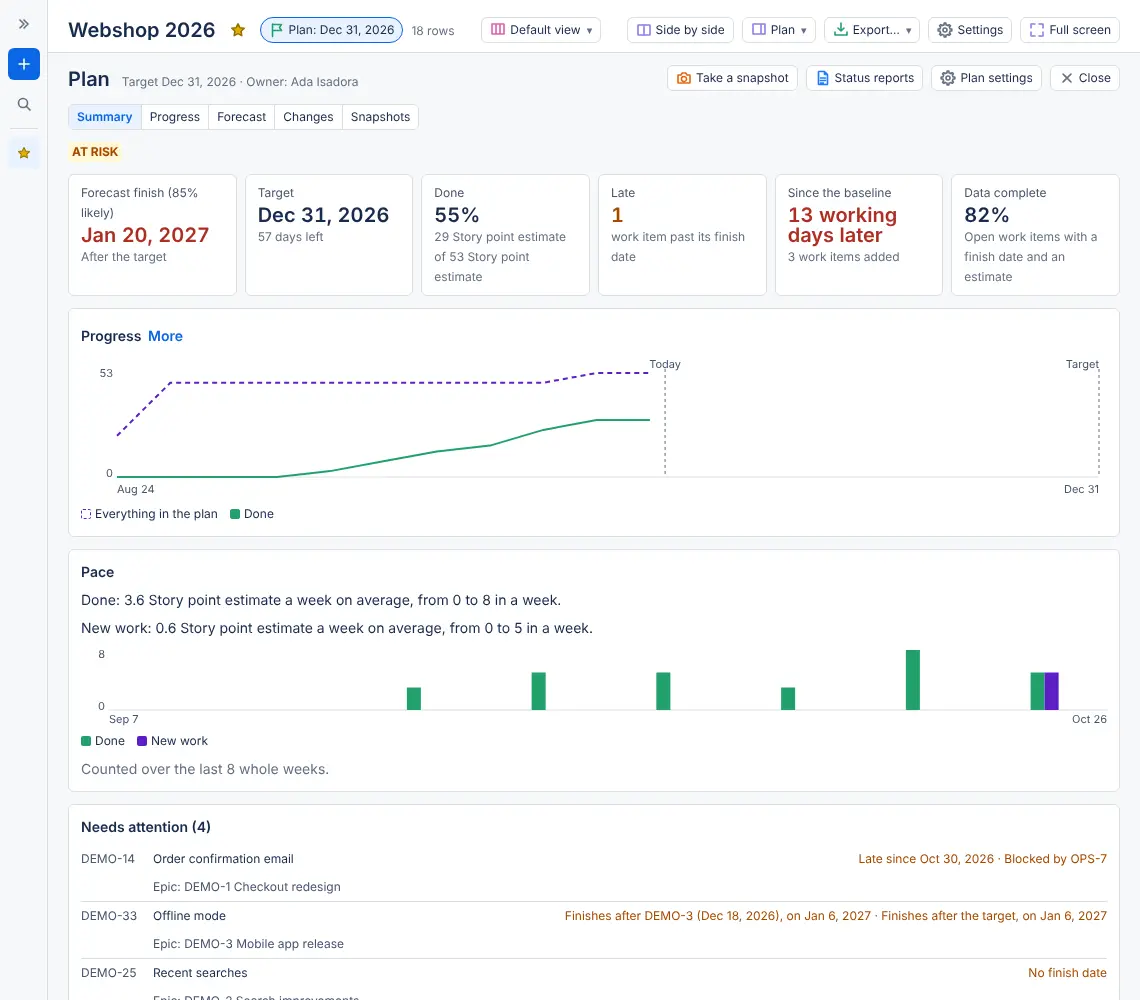
Summary
- The status, and whether the owner set it or it was worked out. Point at a status set by hand to see who set it and when.
- Forecast finish (85% likely), or the Latest planned finish while the plan has no pace yet, with By the target or After the target.
- Target, with the days left. When the target has passed, the Summary says so, with Set a new target for people who can edit the hierarchy.
- Done: the share done, such as "30 of 120".
- Late: open work items past their finish date.
- Since the baseline, when the plan has one: how many working days the latest finish moved, and how many work items were added.
- Data complete: the share of open work items with a finish date, and with an estimate too unless the plan counts work items.
On a plan that counts hours, Estimate against actual shows the hours spent and remaining against what was estimated at first, and by how much the work items with an original estimate are over or under it. Hours on work items that were never estimated are named apart, for example "plus 10 hours on 2 work items without an estimate".
A small progress chart follows, then Pace: the work done and the new work that arrived each week, as weekly averages and as bars, over the weeks the forecast uses. Then comes Needs attention: open work items that are late, that finish after the target, that have no finish date or, when the plan counts points or hours, no estimate. Each one names its epic and why it is listed, such as "Blocked by OPS-7". The most pressing come first, 50 at most. Show them in the grid selects their rows and closes the plan.
Progress
Work done each week against everything in the plan, up to a year back, as a chart and a table. A work item counts in the plan from the week it was created, and as done from the week it was resolved.
Forecast
The forecast runs the work left 2,000 times at the pace of past weeks, each week to come taking one past week drawn at random, with the work done in it and the new work that arrived in it. It shows:
- the dates by which the work left is 50% likely, 85% likely and 95% likely to be done;
- the Chance to finish by the target date;
- Try a change, which moves the Work left and the Pace by up to 50% either way, to see how the dates move. Nothing is saved or written to Jira. Back to the plan as it is puts them back;
- What moves the date: work added lately, the last 4 weeks being slower than the pace the forecast uses, and open work items without an estimate or a finish date.
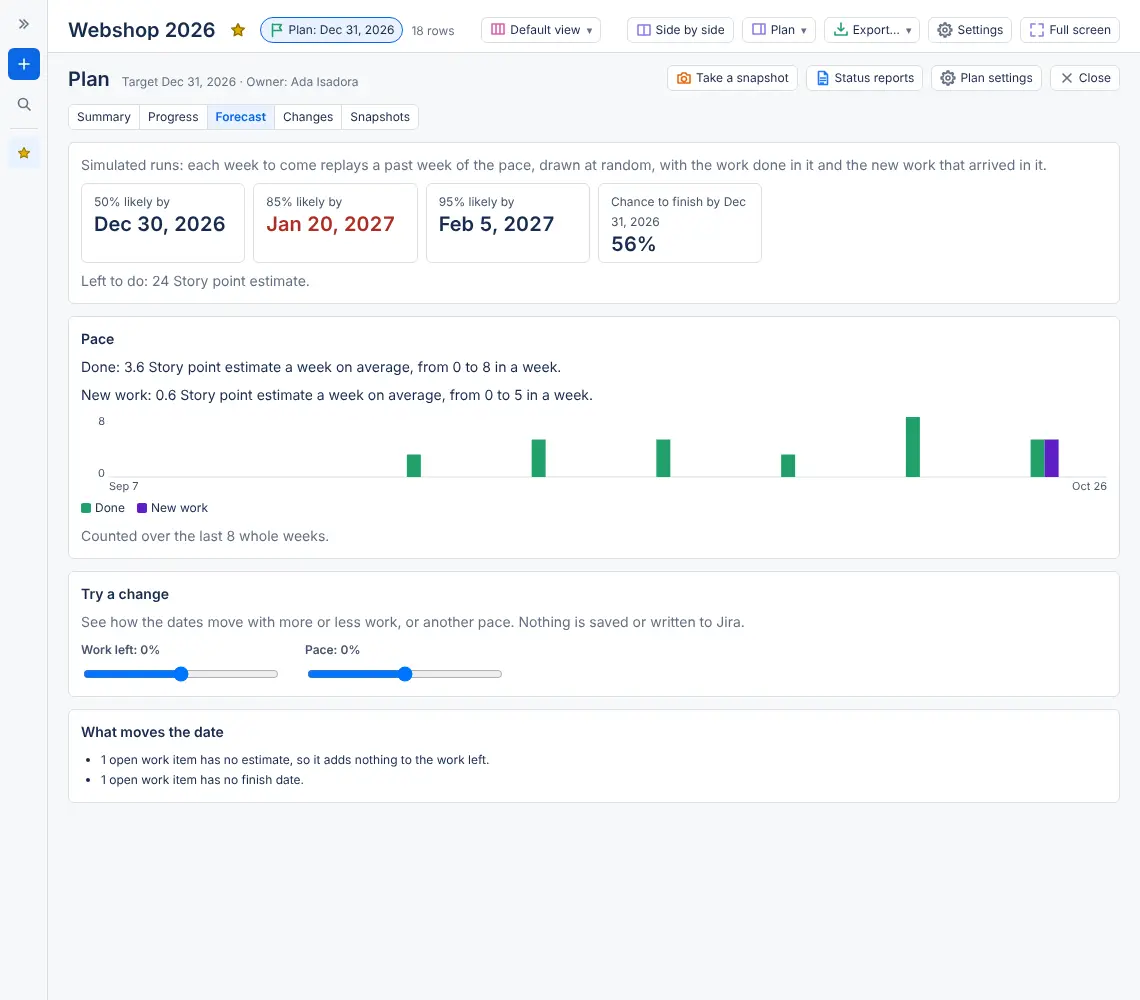
When nothing was done in the weeks the forecast uses, there is no pace yet, and the tab says so. A run that would take more than 10 years reads Not within 10 years. The same plan and the same work always show the same dates.
Changes
With a baseline, the Latest finish of the plan against the baseline in working days, the work items Added and Taken out since the baseline was saved, and those whose Finish moved, the largest move first. Without a baseline, the tab asks you to pick one in the plan's settings. The baseline's dates are worked out from Jira's history.
When the baseline a plan compares with is deleted, the Summary shows Baseline deleted, with "Pick another in the plan's settings", and the Changes tab says the same. Deleting such a baseline names the plan first.
How the status is worked out
When the owner doesn't set the status, the plan works it out:
| Status | When |
|---|---|
| On track | The chance to finish by the target is 85% or more. |
| At risk | It is 50% or more. |
| Off track | It is less than 50%. |
While the plan has no pace yet, the status follows the latest planned finish: on the target or before it is On track, within a week after it At risk, and later Off track.
Finish dates come from the hierarchy's timeline settings: its finish field, or the due date when the timeline keeps its own dates. Story points come from the timeline's story points field, else the site's.
Snapshots
A snapshot keeps a moment of a plan: the date and time, the plan's settings and its list of work items. It keeps no figures. When you open it, its figures are worked out from Jira's history and the work items you can see in Jira.
To take one, select Take a snapshot at the top of the plan, give it a name, and select Take snapshot. Taking a snapshot needs Edit on the hierarchy, and a plan keeps up to 50 snapshots taken by hand. Each shared status report also keeps one, named after the report, which goes when the report is deleted.
To compare, open the Snapshots tab and pick two moments under Compare and With: Today (live, from Jira now), a status report's snapshot, or one taken by hand. Swap turns the comparison round. Anyone who can open the plan can compare.
- How the plan moved sets the two moments side by side: status, forecast finish (85%), target, done, scope, what is left, late work items and pace, with the change between them.
- What changed between the two lists the work items finished, added since, re-estimated, whose finish moved, blocked, started and taken out. Select a kind to see only those, and Show them in the grid to select their rows.
- Each side says "Figures as of …, from what you can see in Jira". While Jira's history is read, a bar says how far it has come, today's figures show at once, and Stop ends the reading.
A work item whose history is too long to read whole is left out of the figures for that moment, and the page says how many. Before a work item was imported into Jira, its estimates and status are the imported values.
The Plans page
Select Plans in the list on the left of the app's page, after Search work items. On a project's Hierarchies tab, it is under More. The page lists every plan you can open, Riskiest first: off track, at risk, no forecast, on track, then done, with the nearest target first within each. Plans move into place as their figures come.
| Column | What it shows |
|---|---|
| Plan | The hierarchy's name, which opens it with its plan. |
| Owner | The plan's owner. |
| Status | On track, At risk, Off track, Done, or No forecast, with a line under it that says why. See below. |
| Target | The target date. |
| Forecast finish | The 85% likely date. "No pace yet, planned date" when there is no pace to forecast from yet, so the date is the latest planned finish. "Can't forecast: no estimates" when no open work item has an estimate the plan can count; point at it to read the whole reason. |
| Done | The share done. |
| Late | Open work items past their finish date. |
| Needs attention | The work items the plan's Needs attention lists. |
| Last report | The day of the last shared status report, which opens it, and the status its author gave, if any. None yet opens the plan's status reports. |
The line under each status says why. A status set by hand reads "Set by name on date: note", with a pencil beside the status. A status worked out from the forecast reads, for example, "Forecast Apr 25, 2027, 12 weeks after the target", or "Planned finish date, 2 weeks after the target" while there is no pace yet, or says why there is no date. A finished plan reads, for example, "Finished 3 weeks before the target". When a line is cut short, point at it or reach it with Tab to read all of it.
Filter by name, Owner and Label narrow the list, and Print prints it. The page works out each plan's figures in turn, with a count of the plans done so far. A plan whose figures could not be read says so on its row, with Try again.
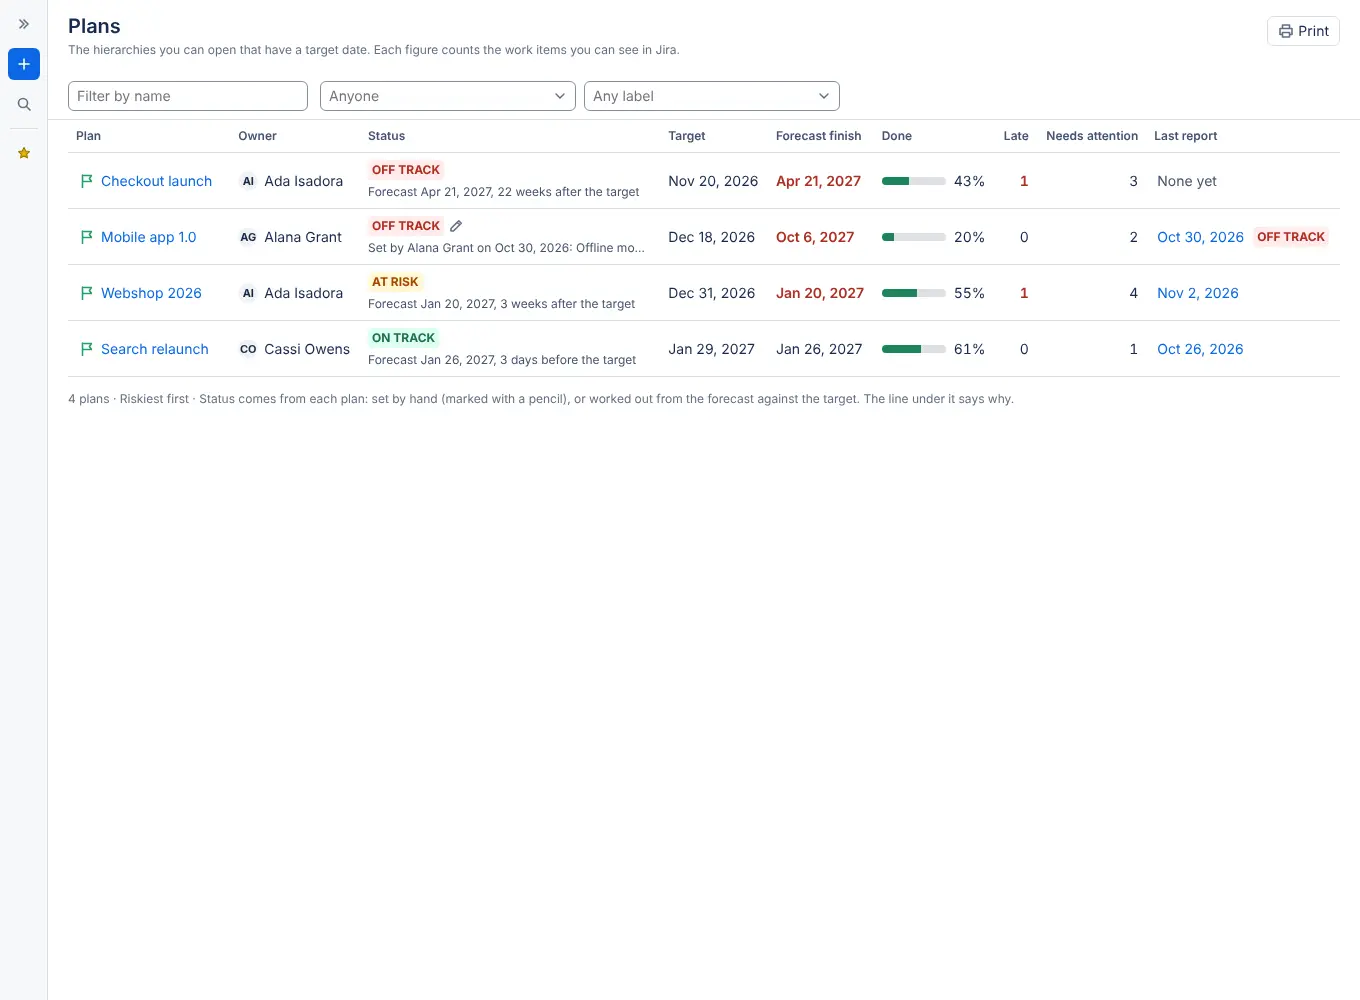
The page's address ends in /plans, so you can copy a link to it.
Status reports
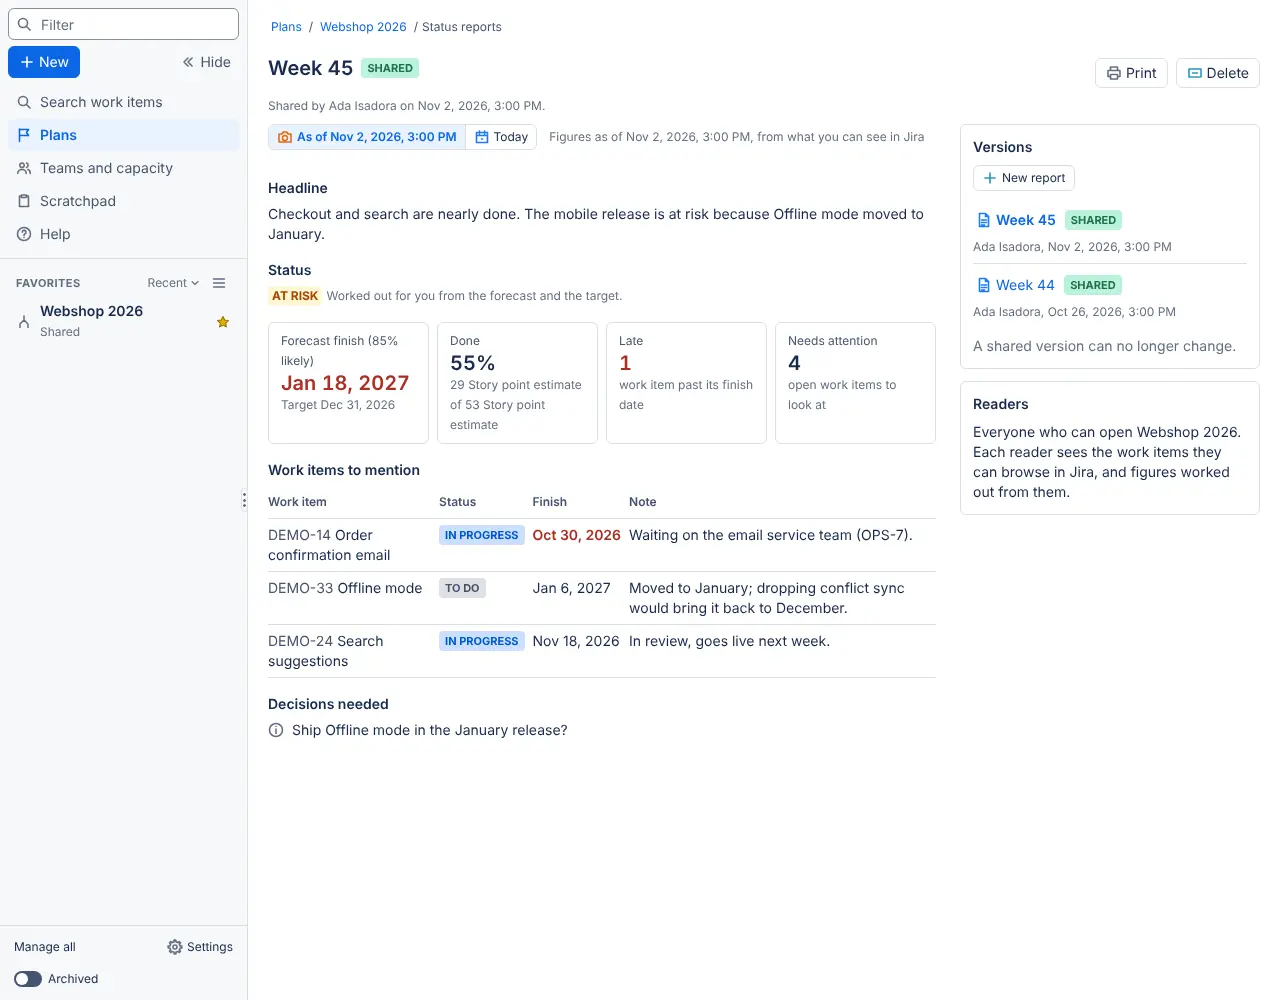
A status report tells everyone who can open a plan how it is going, in the words of the people who look after it. Open them with Status reports in the plan, or from the Last report column of the Plans page. Each report has its own link, which Copy link copies.
A report holds:
- a Title, and a Headline of up to 1,000 characters;
- a Status: Worked out from the forecast (the default), which each reader sees as worked out for them, or On track, At risk or Off track as the author gives it;
- Work items to mention: up to 30 work items of the plan, each with a note of up to 300 characters;
- Decisions needed: up to 10, of up to 300 characters each.
Beside them, the report shows the forecast or planned finish, the share done, the late work items and those that need attention. A shared report shows these figures as of the moment it was shared, worked out from its snapshot for the person reading it. Figures shown switches between As of that date and Today. A report shared before reports kept a snapshot says that its figures are today's. A report never keeps a figure.
Each work item mentioned shows its key, summary, status and finish date as Jira gives them to the reader. A work item mentioned that is no longer in the plan is marked Taken out of the plan. A status the author sets reads "Set by name in this report." The report also says when the plan's list of work items was last refreshed.
Writing a report
Writing a report needs Edit on the hierarchy.
- Select New report. The report starts as a Draft, which only you can see. It starts from the last shared report: its status, the work items it has notes on with their notes, and its open decisions. Write a new headline.
- Fill it in, with Add work items to find work items of the plan and Add a decision, which puts the cursor in the new decision. Note boxes grow as you type, and the report uses the width of a wide window. Select Save draft as often as you like.
- Select Share this version. Everyone who can open the plan can then read it, and it can no longer change.
Near a limit, a field says how much is left, for example "980 of 1,000 characters" or "24 of 30 work items". Nothing is cut: past the limit, the report says so and saves once you shorten it.
Sharing a report with a status set by hand also sets the plan's status to it, with the headline as the note saying why, and the Plans page shows it.
The next report is a new version. Versions, beside the report, lists them all, the latest first, with who wrote each and when. Someone with Edit on the hierarchy may delete a shared version. Only its author may delete a draft. Leaving a draft with changes that aren't saved asks first.
Who sees what
- Everyone who can open the hierarchy reads its shared reports.
- A draft is its author's alone. To anyone else it reads as if it didn't exist.
- A note about a work item shows only to readers who can browse that work item in Jira. A reader who can't sees nothing of it, not even that it is there.
Shared versions go into backups. Drafts never do.
Publishing a status report to Confluence
Once a status report is shared, anyone who can open its plan can publish it: open the report and select Publish to Confluence. The page holds the headline, the status, the figures as of the report's snapshot, the work items it mentions with their notes, and the decisions. A draft is never published. The window works as for a report, and the page holds the same kinds of things.
When a page was published before, the window starts on Update the page published on date, with the page's title and space. Select Update the page: the page gets a new version, and its earlier versions stay in its history. Select Publish a new page to make another one instead. When someone with Edit on the hierarchy publishes a plan's status report, the plan remembers the page, so the next report can update it, whoever publishes it.
Where the figures come from
The plan, the Plans page and status reports work out their figures in your browser, from the work items Jira returns to you. A work item you can't see in Jira is never counted, and nothing says it is there. A work item that Jira was too busy to return is left out for now, with a note saying how many and Try again.
Progress and the pace come from dates Jira keeps on every work item: when it was created, and when it was resolved (or when its status last changed category, for a done work item without a resolution date). A work item that went back from Done counts as not done.
The app keeps a plan's settings and the reports' words, never a figure.
Questions about the app? Ask us in Plugincraft Support, our help center, or write to info@plugincraft.ca.