Charts and reports (Coming Soon)
The charts panel shows charts of the rows you are looking at, beside the grid. A hierarchy's report puts how its work is going on one page you can print or save as PDF, and you can keep reports of your own or share them. Chart templates keep a chart's settings under a name, to start charts from on any hierarchy.
Every figure is worked out for the person looking, from the work items they can see in Jira. Two people may see different figures in the same chart or report. See Where the figures come from.
The charts panel
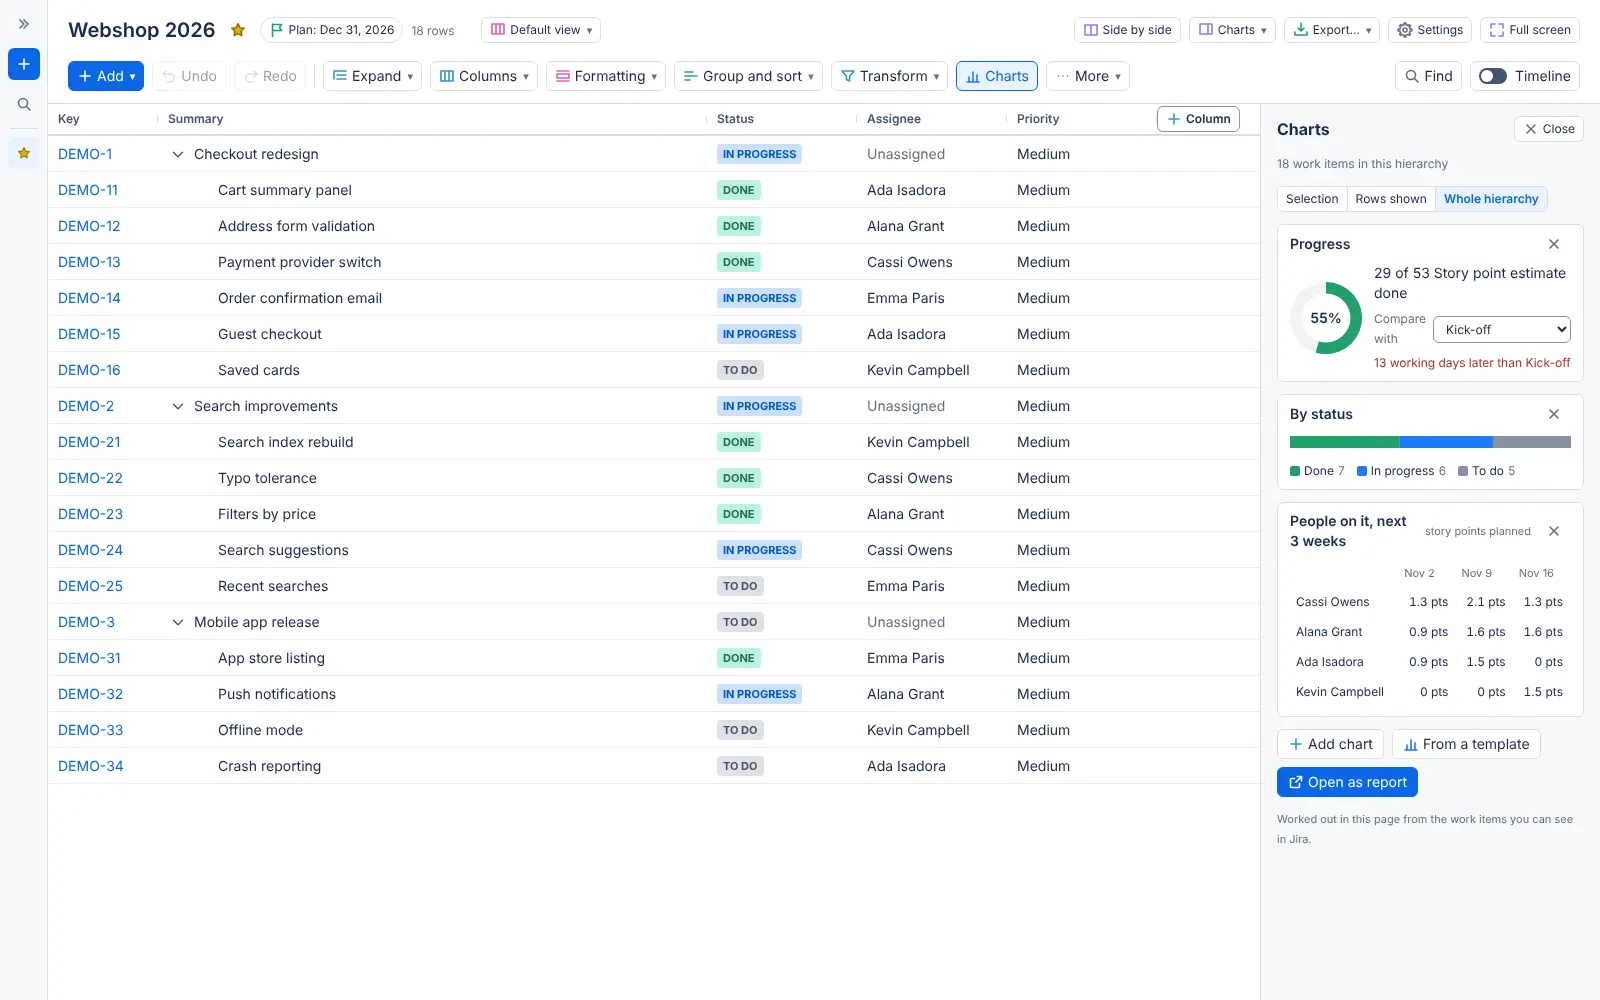
Select Charts in the toolbar (under More when the page is narrow), or in the Panels menu on the title line. The panel opens beside the grid. Drag its left edge to make it wider or narrower, or focus the edge and use the arrow keys. It opens again next time if you leave it open.
What the charts cover
The switch at the top of the panel picks what the charts count:
- Selection (the default): the selected rows and every row under them, or the focused row and its rows when nothing is selected. The charts follow the selection as it changes.
- Rows shown: the rows the grid shows now, after filters, Find and closed rows. Rows inside collapsed groups count too.
- Whole hierarchy: every row loaded.
Each work item counts once, however many rows it has. Folders, memos and planning items are not work items and count for nothing.
Progress, By status and People on it
Three charts show first:
- Progress: a ring with the share done. It adds up story points when any work item counted has them, and counts work items otherwise. Done means Jira's Done status category.
- By status: one bar split into To do, In progress and Done, with a legend.
- People on it, next 3 weeks: each assignee's planned hours per week from this week's Monday, worked out as the workload does it. Done work is left out, and Unassigned comes last. At most 12 people show, the busiest first, with a line for the rest. People who can edit the hierarchy see each person's hours as a share of their hours; everyone else sees the hours planned. When the hierarchy is a plan that counts story points, it counts story points. Otherwise, work needs dates and hours to count, and the chart says so when some doesn't.
To remove one of these three charts, select its × (Remove). Show all charts, beside Add chart, puts back the ones you removed. What you remove is kept for you on this hierarchy, and nobody else's panel changes.
Charts of your own
Select Add chart and choose:
- Chart: Bars, Ring, Stacked bar or Table of values;
- a Title, and a Description shown under the chart;
- Measure: Work items, the sum of a number field (Σ), or its average. The list says how many work items have a value in each number field, so two fields with the same name can be told apart;
- Group by: the status category, a person field, options, versions, components, labels, projects, Parent or a short text field. The fields this hierarchy shows come first, marked In this hierarchy, and Search fields finds the others;
- Filter, if you want: a JQL query, and the chart then counts only the work items it returns. The query runs with your own rights, and is checked as you type it. While it can't be read, the form shows Jira's error and the chart can't be added ("Fix the JQL first").
Bars by status follow the order of the statuses, and work without an assignee shows as Unassigned. A work item in several groups, such as one with two labels, counts in each. Past 12 groups, the smallest are added up as Others. You can keep up to 12 charts on each hierarchy. Your charts and their queries are kept in your browser, for you alone. Removing a chart offers Undo.
To change a chart you added, select its pencil (Change the chart). The same form opens in the chart's place with its settings. Change what you need, then select Save chart, or Cancel to leave it as it was.
From a template, beside Add chart, starts a chart from a chart template. Open as report opens the hierarchy's report and brings the panel's charts into it.
Comparing with a baseline
The Progress chart has Compare with, which lists the hierarchy's baselines. With one picked, it says how many working days the latest finish of the work items counted moved since the baseline was saved, on the site's working calendar. The baseline's finishes are worked out from Jira's history: the chart says "Working out the baseline's finishes from Jira's history…" while it reads, and leaves out a work item whose history is too long to read whole, with a count. The timeline and the report share this choice, so they all say the same thing.
The report
Choose Report in the Panels menu, or select Open as report in the charts panel. On a wide screen, the report opens beside the grid, from the toolbar down, so the rows stay in view. On a narrow screen it covers the grid and the timeline. Close brings them back. A query in query mode has no report.
Above the blocks:
- Compare with picks a baseline, as in the charts panel.
- Print or save as PDF prints the report alone, with a line under its heading giving the day it was printed and the baseline it was compared with. Blocks aren't split across pages.
- Publish to Confluence makes a Confluence page from the report as you see it. It shows once a site admin has connected TreeCraft to Confluence (see Publishing a report to Confluence).
On a narrow window, blocks take more of the width, and on a very narrow one each block takes the whole width.
The Overview
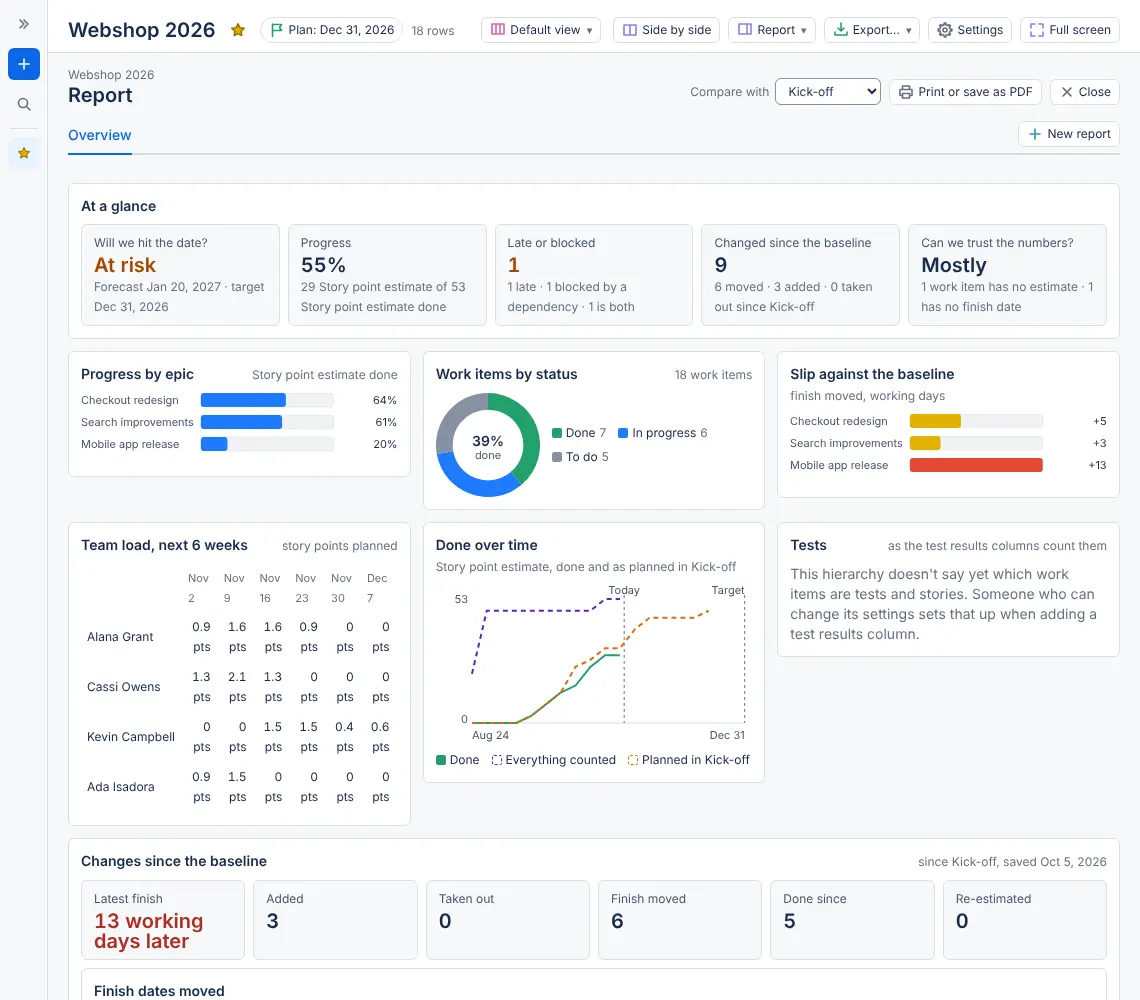
Every hierarchy has the Overview, which shows, in this order:
| Block | What it shows |
|---|---|
| At a glance | Five cards: Will we hit the date? (the plan's status and forecast against its target, or the latest finish when the hierarchy isn't a plan), Progress, Late or blocked (open work items past their finish, and those waiting on a work item that isn't done), Changed since the baseline, and Can we trust the numbers? |
| Progress by epic | Each epic, with the share done. Each work item goes under its epic by its Jira parent, whatever the hierarchy's shape. Work under no epic is listed as Not under an epic. |
| Work items by status | The share done, and how many work items are in each status category. |
| Slip against the baseline | How many working days each epic's latest finish moved since the baseline. |
| Team load, next 6 weeks | Each assignee's planned hours per week, or story points when the plan counts them, as in the charts panel. |
| Done over time | Done and everything counted, week by week, with the target and today. With a baseline, what it planned done by each week. |
| Tests | Stories whose tests all passed, and tests passed, failed and not run, as the test results columns count them. |
| Changes since the baseline | With a baseline: the latest finish against it in working days, the work items added, taken out, whose finish moved, done since and re-estimated, then the finish dates that moved. |
The report counts story points, hours or work items as the plan does. When the hierarchy isn't a plan, it counts story points when any work item has them, and work items otherwise. A work item is blocked when it is open and one of its links of the hierarchy's dependency types says it is blocked by a work item that isn't done.
Can we trust the numbers? reads the share of open work items that have what a forecast needs: a finish date, and an estimate unless the report counts work items. 90% or more reads Yes, 60% Mostly, 30% Partly, and less Not yet.
Blocks
A report is made of blocks. Besides those of the Overview, you can add:
| Block | What it shows |
|---|---|
| Created and resolved | Work items created and work items resolved over the last 30 days, each added up day by day. Where the created line runs above the resolved one, more work came in than was finished. It counts work items, whatever the report counts. |
| Text | A title and your own words, up to 4,000 characters. It takes bold, italics, lists that start with - or 1., and links written as text or as plain web addresses. |
| Work items | A table of key, summary, status, assignee and finish, of all the work items or Only open work items, 200 rows at most. A JQL filter narrows it; left empty, it lists every work item in the report. |
| Chart | A chart like those of the charts panel, by a measure and a field, with an optional JQL query. |
Your own reports and shared reports
The hierarchy's reports show as tabs above the blocks: the Overview, the shared reports, then your own, marked Only you. The tab you last opened opens next time.
Anyone who can open the hierarchy keeps reports of their own and may share them, as a view is shared: with everyone who can open the hierarchy, or only with the people, groups and project roles they pick. A shared report never reaches someone who can't open the hierarchy, and each reader sees figures from the work items Jira lets them see.
| Who | |
|---|---|
| Read a shared report | the people it is shared with, if they can open the hierarchy |
| Keep reports of your own, which nobody else sees | everyone who can open the hierarchy |
| Share a report of your own | its author |
| Change a report and who sees it | its author; for a shared report, the people its author lets change it, and Jira admins |
| Choose who else can change a shared report, or delete a report | its author and Jira admins |
People who see a shared report never see who else it is shared with. Jira admins can see and manage every shared report.
A hierarchy keeps up to 50 shared reports, and each person up to 20 of their own. A report holds up to 24 blocks. Backups keep the shared reports, never anyone's own.
Changing a report
New report starts a report from a copy of the blocks shown. Edit changes the report that is open. While you change a report:
- Report name (up to 120 characters), and Share…. It opens Share this report, where Who can see this report offers Only me, Everyone who can open this hierarchy, or Only these people, groups and project roles. Pick groups, people or project roles from Jira, then select Done. The button then reads Shared with everyone… or Shared with 2…, and the line under it says who sees the report.
- In Share this report, a shared report also has Who can change this report: Only me, or Also these people, groups and project roles. The people you add can change the report and who sees it, and they always see it while they can open the hierarchy. Only you and Jira admins can delete it or choose who can change it.
- Add block adds any kind of block. A text or chart block opens its settings at once, and Cancel there drops it. Escape, or a click beside its window, asks before the new block is lost. From a chart template…, at the end of the list, adds a block from a chart template.
- Each block has its tools above it: Move, its width (A third, Half, Two thirds or Full width), Edit for the blocks that have settings, and Remove, which offers Undo. Drag a block by Move onto another block to put it before or after it, or focus Move and use the arrow keys, Home and End. Each chart block also has Save as template.
- Save report, Cancel, and Delete report, which asks first. Leaving with changes that aren't saved asks first too.
At a glance lets you choose the cards to show. Work items has a title, a JQL filter and Only open work items. Chart has the chart's settings and Only these work items (JQL).
If someone else saved the same shared report after you opened it, your save is refused with "Someone saved this report after you opened it", and your changes stay on the page.
Publishing a report to Confluence
A site admin connects TreeCraft to Confluence first. Until then, reports have no Publish to Confluence button, and nothing else changes.
- Open the report and select Publish to Confluence.
- In Space, pick the Confluence space. The space you published to last time is already picked.
- In Under the page, pick the page to put the report under, or leave it empty to put it under the space's home page.
- Change the Title if you like. It starts as the report's name and today's date.
- Select Publish, then Open the page to see it in Confluence.
The page is made with your own Confluence rights, so Confluence decides which spaces you see and where you may add a page. It holds the report as you see it when you publish it, and doesn't change afterwards. Everyone who can open the page in Confluence sees it as it is, including work items they can't see in Jira, so pick the space with that in mind.
The page holds:
- the blocks that show something. Blocks that show nothing, such as a block that only asks for a baseline or a list with no rows, are left out, and the window lists them under Left out of the page before anything is sent;
- work item keys that link to the work items in Jira. A list that stops at its limit links to a Jira search for the rest (Open them in Jira);
- people's names, linked to their Confluence profiles. Publishing notifies no one;
- charts as Confluence charts, each with a table of its values. Statuses, and the cells of Team load, keep their colours;
- a last line saying the figures were worked out from what the person who published could see in Jira that day, and Open in TreeCraft, which links back to the hierarchy.
If Confluence refuses, the window says why: for example, when you can't add pages to the space, when the space already has a page with that title, or when someone changed the page at the same moment.
A plan's status reports are published the same way, and can update the page published before. See Publishing a status report to Confluence.
Chart templates
A chart template keeps a chart's settings under a name: its kind, its measure, the field it groups by and its JQL query. It never keeps a figure or a work item. A chart made from a template counts the work items Jira gives the person looking.
Using a template
Select From a template in the charts panel, or Add block then From a chart template… while you change a report. The Chart templates window lists the templates by category: Progress, Workload and Quality first, then the other categories by name, then No category. Each template is marked Built-in, Shared or Only you, and says in words what it makes. Search templates finds them by name, category or those words.
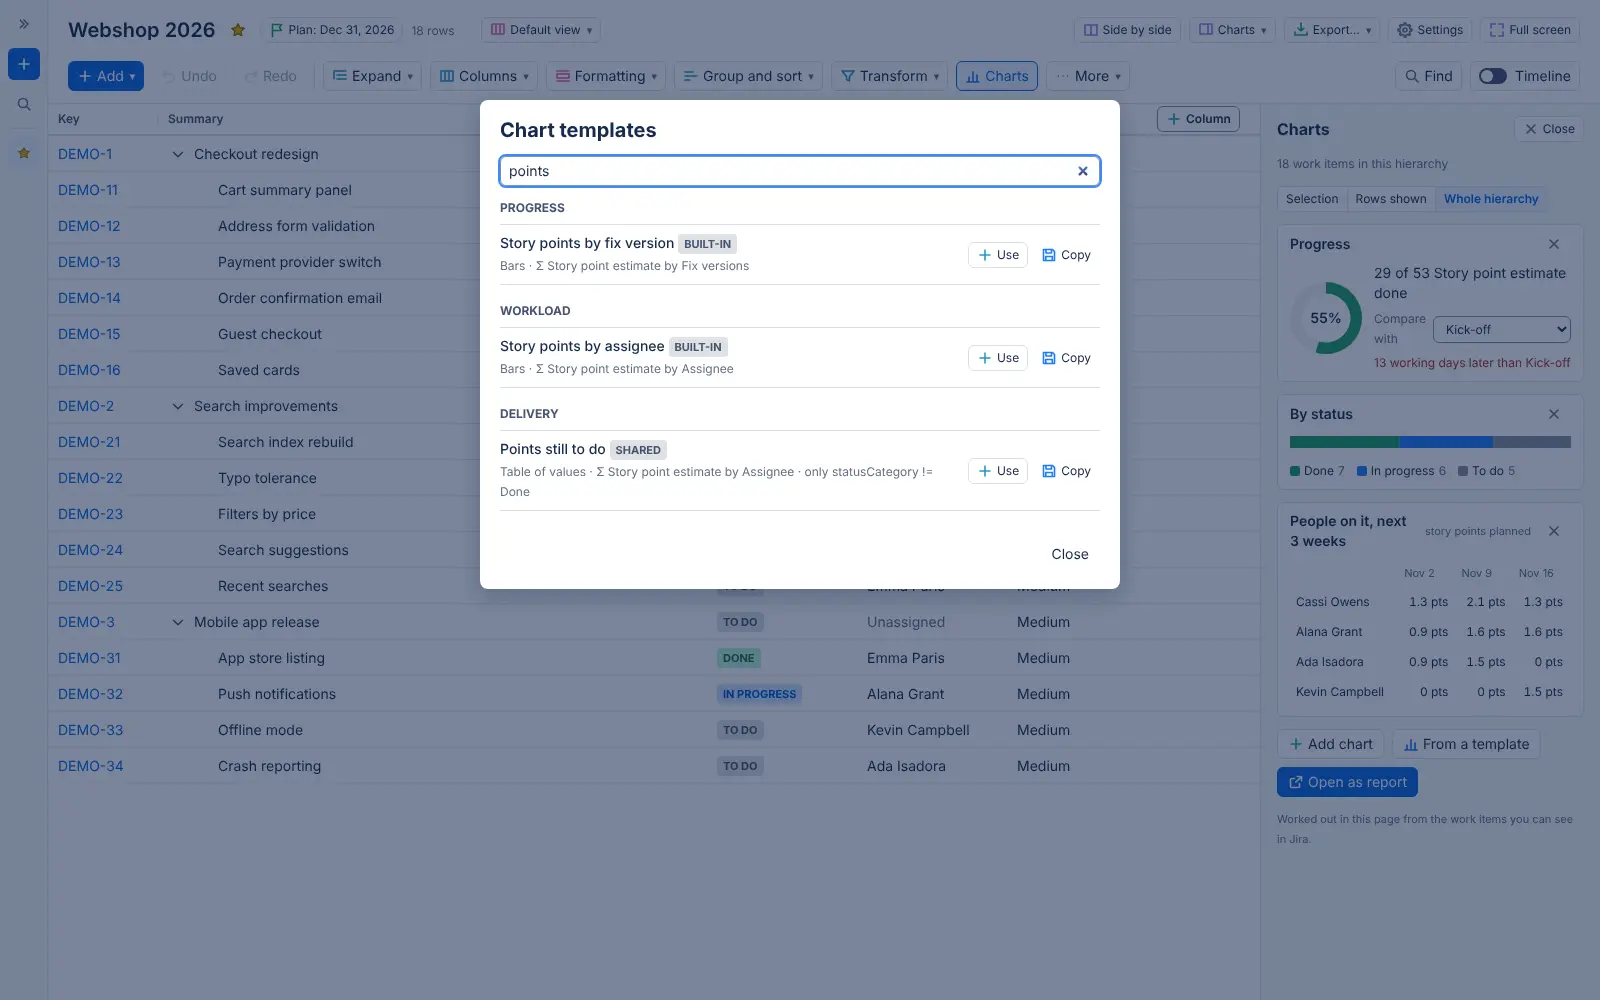
Select Use to add the template's chart. The chart is a copy: changing it never changes the template, and changing or deleting the template never changes a chart already made from it.
A template that names a field this site doesn't have says Not available and can't be used. This happens with a template restored from another site's backup, or a built-in template on a site without a story points field.
Keeping and sharing templates
Save as template is on each of your charts in the charts panel, and on each chart block of a report you are changing. Give the template a Template name (up to 120 characters) and a Category if you want one, then select Save template. In the template list:
- Edit and Delete are on your own templates. Jira admins also have them on every shared template.
- Copy makes a template of your own from any template that makes a chart, named "Copy of …".
Who can use this template shares it as a view is shared: Only me, Everyone who uses TreeCraft on this site, or Only these people, groups and project roles, picked from Jira. Anyone can share their own templates. A shared template also has Who can change this template: only you, or also the people, groups and project roles you pick. They can change the template and who can use it, and they can always use it. Only the person who made it and Jira admins can delete it or choose who can change it, and only the person who made it can make it their own again. A template keeps settings only, so a chart made from it counts only the work items each person can see in Jira.
You can keep up to 100 templates, and a site up to 300 shared ones. Backups keep the shared templates; your own stay on their site.
Built-in templates
The app brings these templates. They can't be changed or deleted, but Copy makes one that makes a chart your own. The five that add a report block are offered in reports only.
| Category | Template | Makes |
|---|---|---|
| Progress | Work items by status | Bars, work items by status |
| Progress | Work items by status category | Ring, work items by status category |
| Progress | Story points by fix version | Bars, story points by fix version |
| Progress | Done over time | The report's Done over time block |
| Progress | Slip against the baseline | The report's Slip against the baseline block |
| Workload | Story points by assignee | Bars, story points by assignee |
| Workload | Open work items by assignee | Bars, open work items by assignee |
| Workload | Remaining estimate by assignee | Table, remaining estimate by assignee, open work items only |
| Workload | Team load, next 6 weeks | The report's Team load block |
| Quality | Open work items by priority | Bars, open work items by priority |
| Quality | Work items by work type | Ring, work items by work type |
| Quality | Done work items by resolution | Stacked bar, done work items by resolution |
| Quality | Created against resolved, last 30 days | The report's Created and resolved block |
| Quality | Tests by result | The report's Tests block |
Where the figures come from
Charts and reports are worked out in your browser, from the work items Jira returns to you. A work item you can't see in Jira is never counted, and nothing says it is there. A work item that Jira was too busy to return is left out for now, with a note saying how many and Try again.
The app keeps your charts in your browser, and reports and templates as settings and words. It never keeps a figure.
Questions about the app? Ask us in Plugincraft Support, our help center, or write to info@plugincraft.ca.